

SUI's L1 Replay Pattern: Why It Looks Like Solana 2021


.svg)

SUI's 2024-2025 price action replayed patterns from SOL's 2021 cycle: initial spike, sharp correction, then sustained breakout as ecosystem metrics improved. The pattern reflects common L1 dynamics — initial speculation, correction, then utility-driven growth. Tradeify247 traders using the historical framework can identify which stage of the cycle they're in and position accordingly.
SUI's L1 Replay Pattern: Why It Looks Like Solana 2021
SUI's price action in 2024-2025 showed structural similarities to Solana's 2021 cycle: a strong initial move after launch, a sharp correction, then a sustained breakout as the ecosystem developed. The pattern is similar enough that traders familiar with SOL's 2021 trajectory can recognize the stages in SUI's price action. Tradeify247 traders running altcoin strategies benefit from understanding how previous L1 cycles played out to inform current trades.
The replay pattern isn't exact — every L1 cycle has unique characteristics — but the structural similarity is strong enough that historical SOL analysis provides a useful framework for trading SUI on Tradeify247. Understanding the pattern helps traders identify which stage of the cycle they're in and position accordingly.
Solana 2021 vs SUI 2024-2025: The Similarities
Both SOL and SUI launched with strong technical narratives — high throughput, low fees, modern architecture. Both saw initial price spikes that were followed by sharp corrections when early enthusiasm faded. Both experienced sustained breakouts once the ecosystem matured and real applications drove ongoing demand.
Tradeify247 traders who study both cycles can identify common markers: ecosystem TVL growth, developer activity, application launches, and user growth metrics. These fundamentals drive the second-stage breakout in both cycles, and the pattern appears consistent enough that SUI's second-stage breakout in 2024-2025 followed the same script as SOL's in 2021.
What Drove the Replay Pattern
The replay pattern reflects common dynamics in L1 cycles: initial speculation, correction as reality sets in, then sustained growth as the ecosystem finds product-market fit. SOL in 2021 went through these stages; SUI followed the same arc three years later. The pattern reflects the time it takes for a new L1 to move from launch hype to real utility.
Tradeify247 traders who understand the underlying dynamics can anticipate the stage transitions. When ecosystem metrics improve (TVL growth, active users, developer activity), the second-stage breakout becomes more likely. When metrics stagnate, the token is more likely to remain range-bound or continue declining.
How to Trade the Replay Pattern
Trading the replay pattern requires identifying which stage of the cycle the L1 is in. Early stages favor accumulation and patience; mid-stages favor momentum trading; late stages favor distribution and risk reduction. Tradeify247 traders running altcoin strategies need to adjust their approach based on the stage assessment.
For SUI specifically, the second-stage breakout occurred in 2024 when ecosystem metrics reached thresholds that historically preceded sustained breakouts in L1 cycles. Tradeify247 traders who recognized the stage transition captured significant upside; traders who entered too early (in the post-launch correction) suffered drawdowns before the breakout.
Why the Pattern May Not Repeat Exactly
The replay pattern isn't deterministic. Every L1 cycle has unique characteristics, and external factors (regulatory environment, market conditions, competitive landscape) affect outcomes. SOL's 2021 cycle occurred during a specific market regime; SUI's 2024-2025 cycle occurred in a different regime with different conditions.
Tradeify247 traders using the replay pattern as a framework should treat it as a guide rather than a prediction. The pattern provides structure for thinking about L1 cycles, but specific timing and magnitude will always vary. Adjust position sizing based on the stage assessment, but maintain flexibility for outcomes that don't match the historical pattern.
Lessons for Future L1 Launches
The SOL 2021 / SUI 2024-2025 comparison provides a framework for evaluating future L1 launches. Tradeify247 traders evaluating new L1 tokens can use the pattern to assess which stage the token is in and what price action to expect. The framework isn't a winning strategy by itself, but it provides useful structure for new-launch decisions.
For traders considering new L1 tokens, the framework suggests: be patient through the post-launch correction, watch for ecosystem metric improvements, position for the second-stage breakout when fundamentals confirm the pattern. The framework worked for SOL in 2021 and SUI in 2024-2025; whether it works for future L1s depends on whether the underlying dynamics remain the same.

Trade Crypto Without Limits
Tradeify is built for crypto traders who want clarity, consistency, and speed — not surprises.


Comparing Ecosystem Development
SOL's 2021 ecosystem growth was driven by a wave of new applications, particularly in DeFi and NFTs. SUI's 2024-2025 ecosystem growth followed a similar trajectory with different applications leading the way. Tradeify247 traders comparing the two cycles should look at the application categories driving growth, not just the TVL numbers.
The application mix matters because different categories have different growth trajectories and durability. DeFi applications tend to have more sustainable growth than NFT-driven ecosystems. Tradeify247 traders evaluating L1 ecosystems should assess the application mix and the durability of the growth drivers.
Developer Activity and Ecosystem Health
Developer activity is a leading indicator for L1 ecosystem health. SOL's developer activity grew substantially through 2021; SUI's grew through 2024-2025. Tradeify247 traders monitoring developer activity can anticipate ecosystem growth before it shows in price action.
Developer metrics include: GitHub commits, active developers, new project launches, and developer retention. Tradeify247 traders using these metrics as leading indicators get earlier signals than traders who wait for TVL or user growth to confirm the trend.
Competitive Position in the L1 Market
The L1 market in 2024-2025 is more competitive than it was in 2021. SOL's success in 2021 was partly due to the limited number of high-performance L1s available. SUI faces more competition from other L1s launching around the same time. Tradeify247 traders should account for the competitive dynamics when evaluating L1 trades.
The increased competition affects both the magnitude and duration of L1 cycles. Tokens with stronger differentiation (technical advantages, ecosystem incentives, application traction) tend to outperform more generic L1 launches. Tradeify247 traders should evaluate the competitive position before committing capital.
How Risk Profiles Differ Between Cycles
L1 tokens in mature markets carry different risk profiles than tokens in less mature markets. SOL in 2021 had higher potential upside because the L1 market was less saturated. SUI in 2024-2025 had lower potential upside but also lower downside risk because the broader crypto market was more mature.
Tradeify247 traders using historical patterns should adjust their risk expectations based on the current market regime. The pattern may replay, but the magnitude and duration will reflect the specific conditions of each cycle. Position sizing should account for the different risk profile.
The Role of Institutional Adoption
Institutional adoption of L1s has grown significantly since 2021. SOL's 2021 cycle was driven primarily by retail traders; SUI's 2024-2025 cycle includes more institutional participation through ETFs, structured products, and institutional custody solutions. The institutional layer affects how the cycle plays out.
Tradeify247 traders should consider how institutional adoption changes L1 trading dynamics. Institutional flows tend to be larger and more sustained than retail flows, which can extend cycles and reduce volatility in some cases. The pattern replay framework should account for these structural changes.
The conversation happens live
Blog comments are too slow for crypto. Join 12,000+ traders in our Discord to discuss this article, share charts, and debate the market in real-time.
Join Discord
Using the Framework on Tradeify247
The SOL 2021 / SUI 2024-2025 replay pattern provides a useful framework for L1 trading on Tradeify247. The pattern isn't deterministic, but it provides structure for evaluating L1 trades at different stages of the cycle. Tradeify247 traders who understand the framework can apply it to current and future L1 tokens.
For practical application, track the ecosystem metrics that drove both cycles: TVL growth, developer activity, application launches, and user growth. These metrics lead price action in L1 cycles, and Tradeify247 traders who monitor them get earlier signals than traders waiting for price confirmation.
The replay pattern worked for SOL and SUI. Whether it works for future L1s depends on whether the underlying dynamics remain consistent. Tradeify247 traders should use the framework as a guide, not a guarantee, and adjust position sizing based on the specific characteristics of each token and the current market regime.

Keep Reading
See all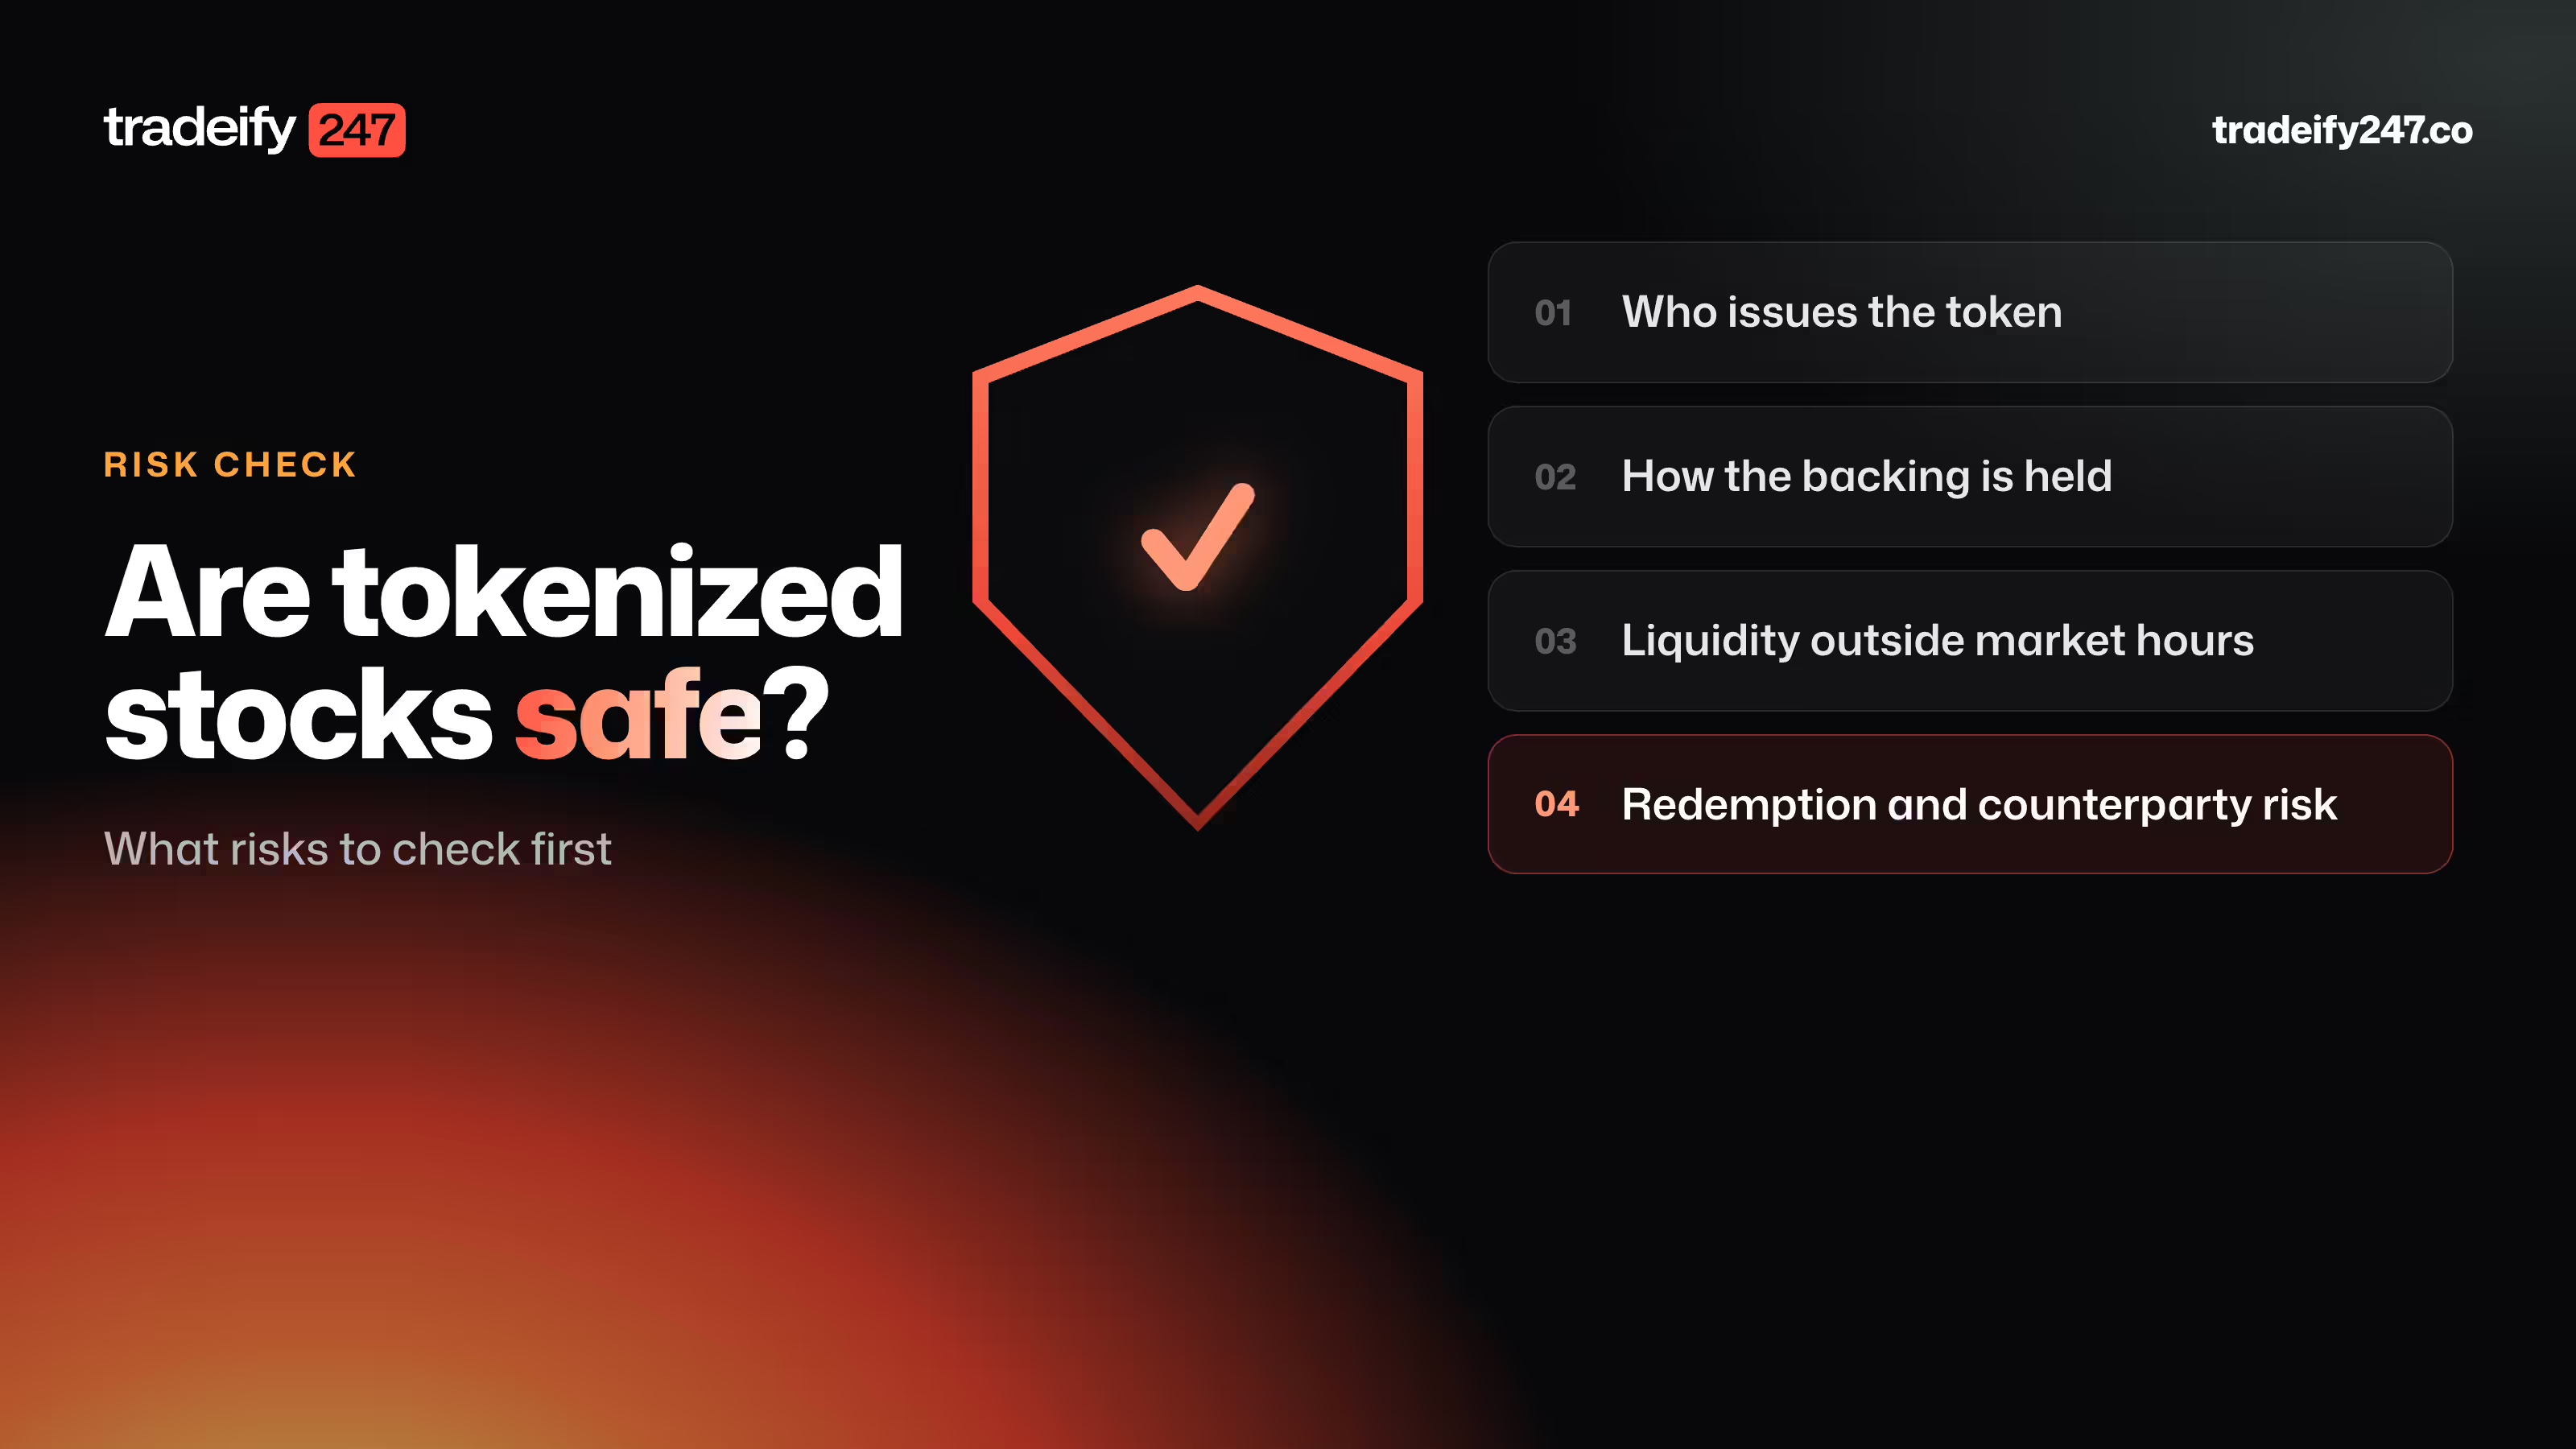
Are Tokenized Stocks Safe and What Risks to Check First
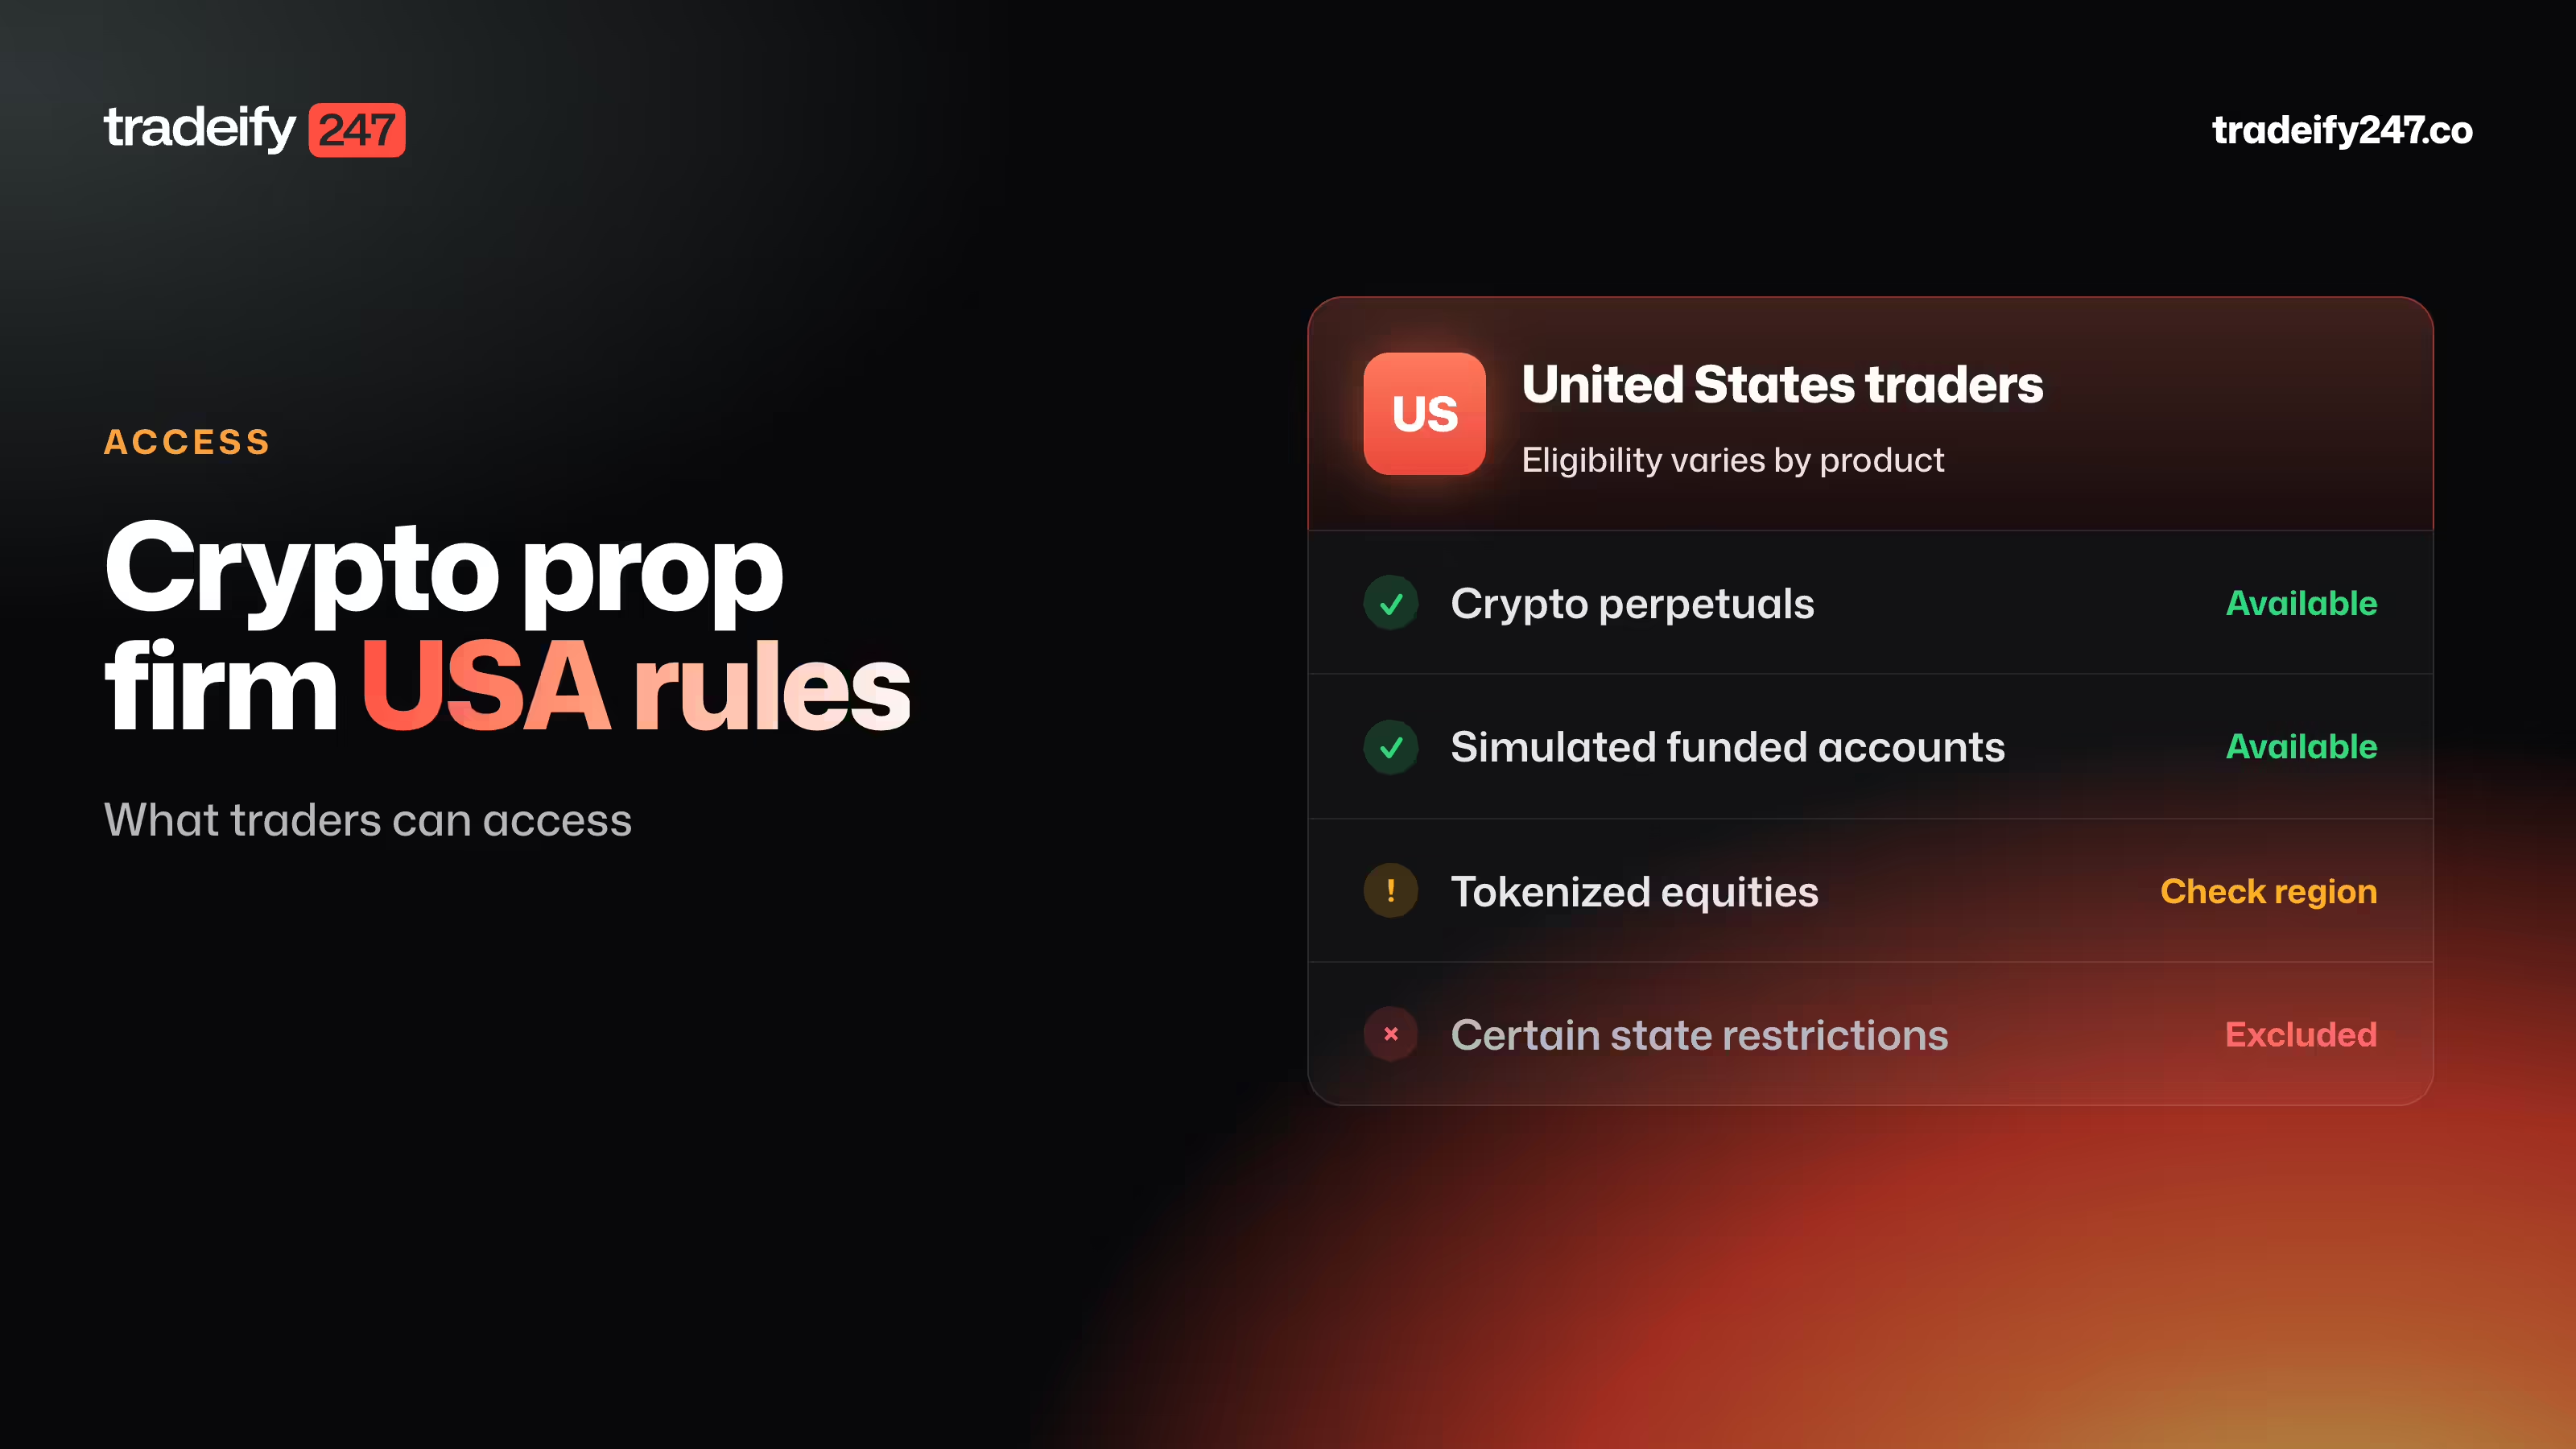
Crypto Prop Firm USA Rules and What Traders Can Access